
Introduction
Generally speaking, processors are responsible for executing operations in computing systems, including computers and microcontrollers. However, a processor in isolation cannot perform any task without access to the information that describes what must be done (instructions) and which data must be processed (inputs).
To do this, the processor needs to access this information stored in memory through clock cycles — periodic pulses that synchronize all internal operations. Analogously, each memory access can be understood as an effort made by the processor: the smaller this effort, the greater the system's efficiency in terms of execution time and power consumption.
This effort is directly related to access latency and the speed with which information can be made available to the processor after a request. It is exactly this aspect that motivates the existence of the memory hierarchy, an architectural model that organizes the different types of storage according to cost, capacity, and performance, in addition to defining the paths through which data reaches the CPU.
Within this hierarchy emerges the protagonist of this article: the cache. The cache plays a central role in reducing the effort required to access frequently used information, bringing data and instructions closer to the processor and, consequently, significantly increasing system performance.
However, this performance gain comes with important challenges, especially in critical embedded software projects. In these systems, characteristics such as temporal determinism and execution predictability are just as relevant as raw performance, and the indiscriminate use of cache can introduce undesired temporal variability, often resulting in a trade-off between speed and predictability in these projects.
In this article, we will explore the fundamentals of how cache works, its role within a conventional memory hierarchy, its limitations, and, most importantly, practical experiments on real hardware, demonstrating the characteristics, benefits, and nuances of cache usage in embedded systems.
First Things First 💡
Before we understand cache, we need to talk about the concepts of locality and the memory hierarchy.The Principle of Locality
The central idea is that programs do not access memory randomly. They tend to focus on "neighborhoods" of data and instructions. There are two types:

- Temporal Locality: If you accessed a piece of data now, it is very likely you will access it again soon (e.g., a sum variable inside a loop).
- Spatial Locality: If you accessed address 100, it is very likely you will access address 104 next (e.g., traversing an array).
Example in C
Loop with good temporal and spatial locality
        #include <stdint.h>

        #define N 1024

        uint32_t data[N];

        int main(void)
        {
            uint32_t sum = 0;

            for (uint32_t i = 0; i < N; i++)
            {
                sum += data[i];
            }

            return 0;
        }
In this example, the variable sum is accessed at every iteration of the loop.
Since the time interval between accesses is small, there is good temporal
locality with respect to sum.
The array data, in turn, is traversed sequentially, in the same order
in which its elements are stored in memory. This access pattern,
known as stride-1, provides good spatial locality,
since accessing data[i] tends to bring neighboring elements into the cache.
Since the loop body exhibits temporal locality for sum and
spatial locality for data, the function as a whole has
good memory locality.
Memory Hierarchy (a brief briefing)
Computing systems use a memory hierarchy because storage technologies present large differences in cost, capacity, and access latencies. Faster memories are smaller and more expensive; slower memories are larger and cheaper.
The processor directly accesses only the upper levels of this hierarchy to gather data and perform operations, the level where the registers are located. Just below are the cache memories (typically SRAM), which have very low access latencies, while lower levels, such as DRAM and disks, have much higher latencies.
This is exactly the point where cache starts to make sense.
Real programs tend to reuse recently accessed data or request information from nearby regions of memory; cache exploits exactly this behavior to reduce average access latency.
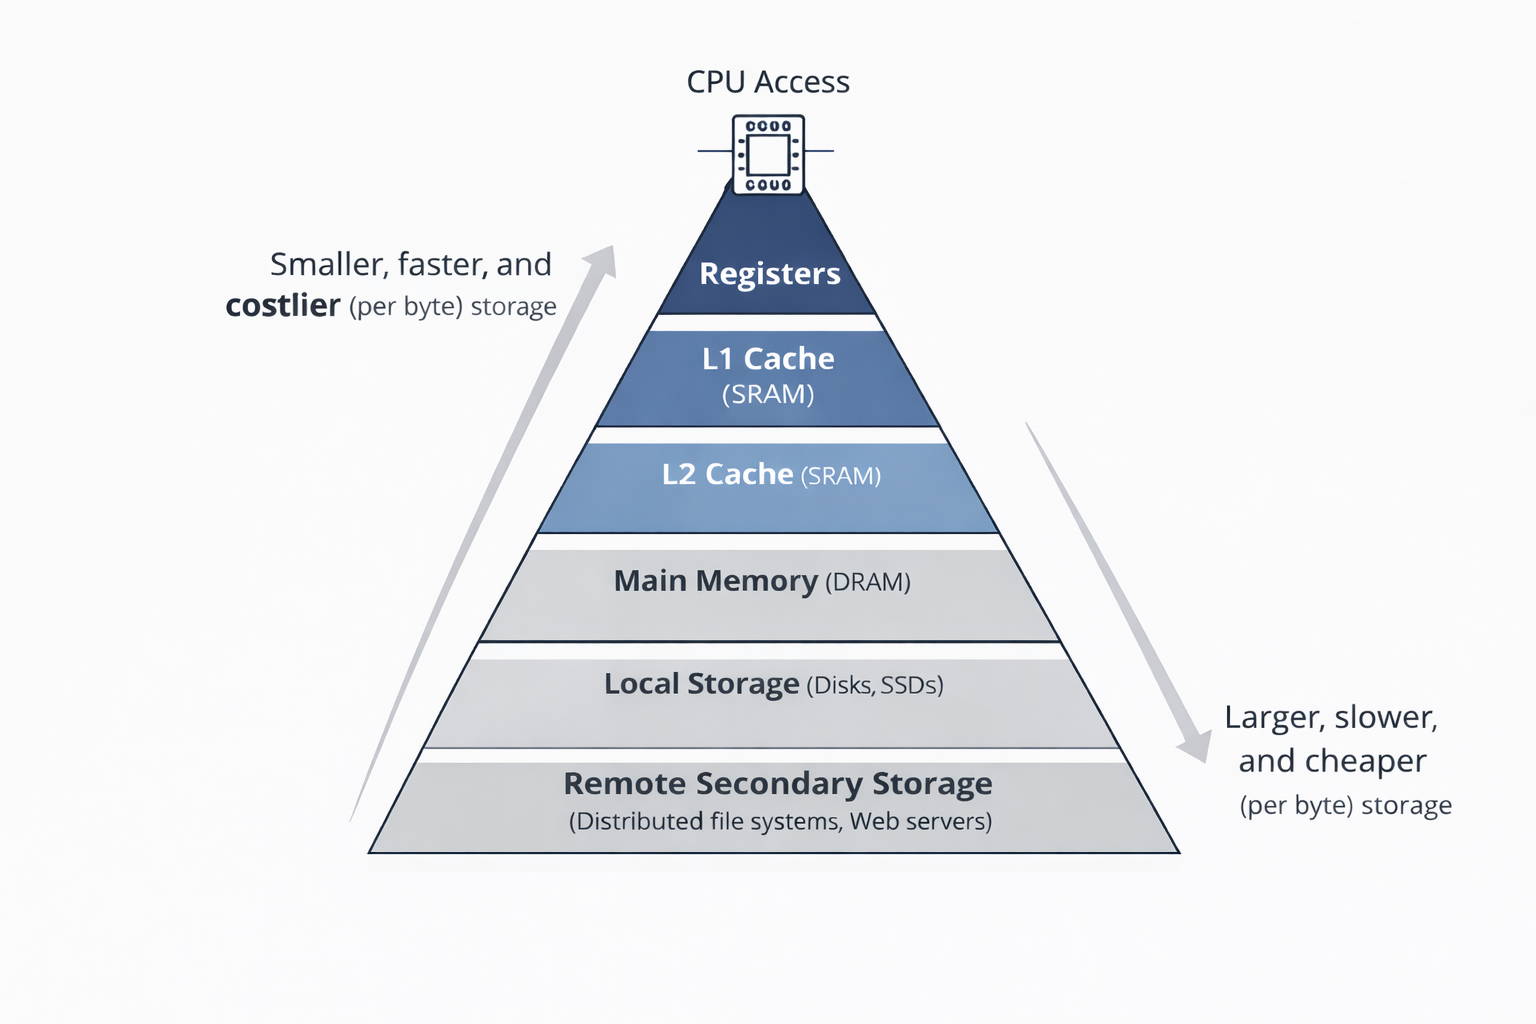
The Timescale of Processor Access to Data in Memory
To understand cache, imagine the processor needs a specific piece of data: if it is in the Registers (inside the chip), the cost is zero, because the Compiler has already planned the code so that the data would be there at the exact moment it was needed. But if it is not there, during run-time it will look in the L1 Cache, where only 1 clock cycle will be spent. If the data is also not in L1, it will need to look in L2, which will make the operation time rise to 10 cycles. If the data still cannot be found in the caches, the search will go to Main Memory (RAM) and would take 100 cycles. The difference becomes even more brutal when accessing the Local Disk (SSD/HD), where the wait jumps to 10,000,000 cycles under the management of the OS. Finally, fetching the data from the Web on a Remote Server can take up to 1,000,000,000 cycles. Without cache, the processor would sit idle for billions of cycles waiting for a response that the L1 cache delivers in just one.
Characteristics of Cache Usage
The Mechanism: Hit vs. Miss
- ✅ Cache Hit: The requested data is in the cache (a location we will call level N). Immediate and fast access.
- ⚠️ Cache Miss: The data is not at level N. The system will need to fetch it from level N+1 of the memory hierarchy, copying the block to the upper level.
Types of Misses (Common Misses)
There are three main reasons why data may not be in the cache:
- Cold (Compulsory) Miss: The cache is empty (cold). Common when a program starts.
- Conflict Miss: The cache has space, but multiple data items "fight" for the same position due to the hardware's placement policy.
- Capacity Miss: The program's active data set (Working Set) is larger than the total capacity of the cache.
Generic Cache Organization
A cache is organized as a set of sets (sets). Each set contains one or more cache lines, and each line stores:
- a data block (copied from main memory);
- a valid bit, which indicates whether the line contains valid data;
- a tag, which stores the most significant bits of the address, identifying which block of main memory the data was copied from.
The total size of the cache is given only by the sum of the data blocks. Tag and valid bits are just metadata and do not count as usable capacity.
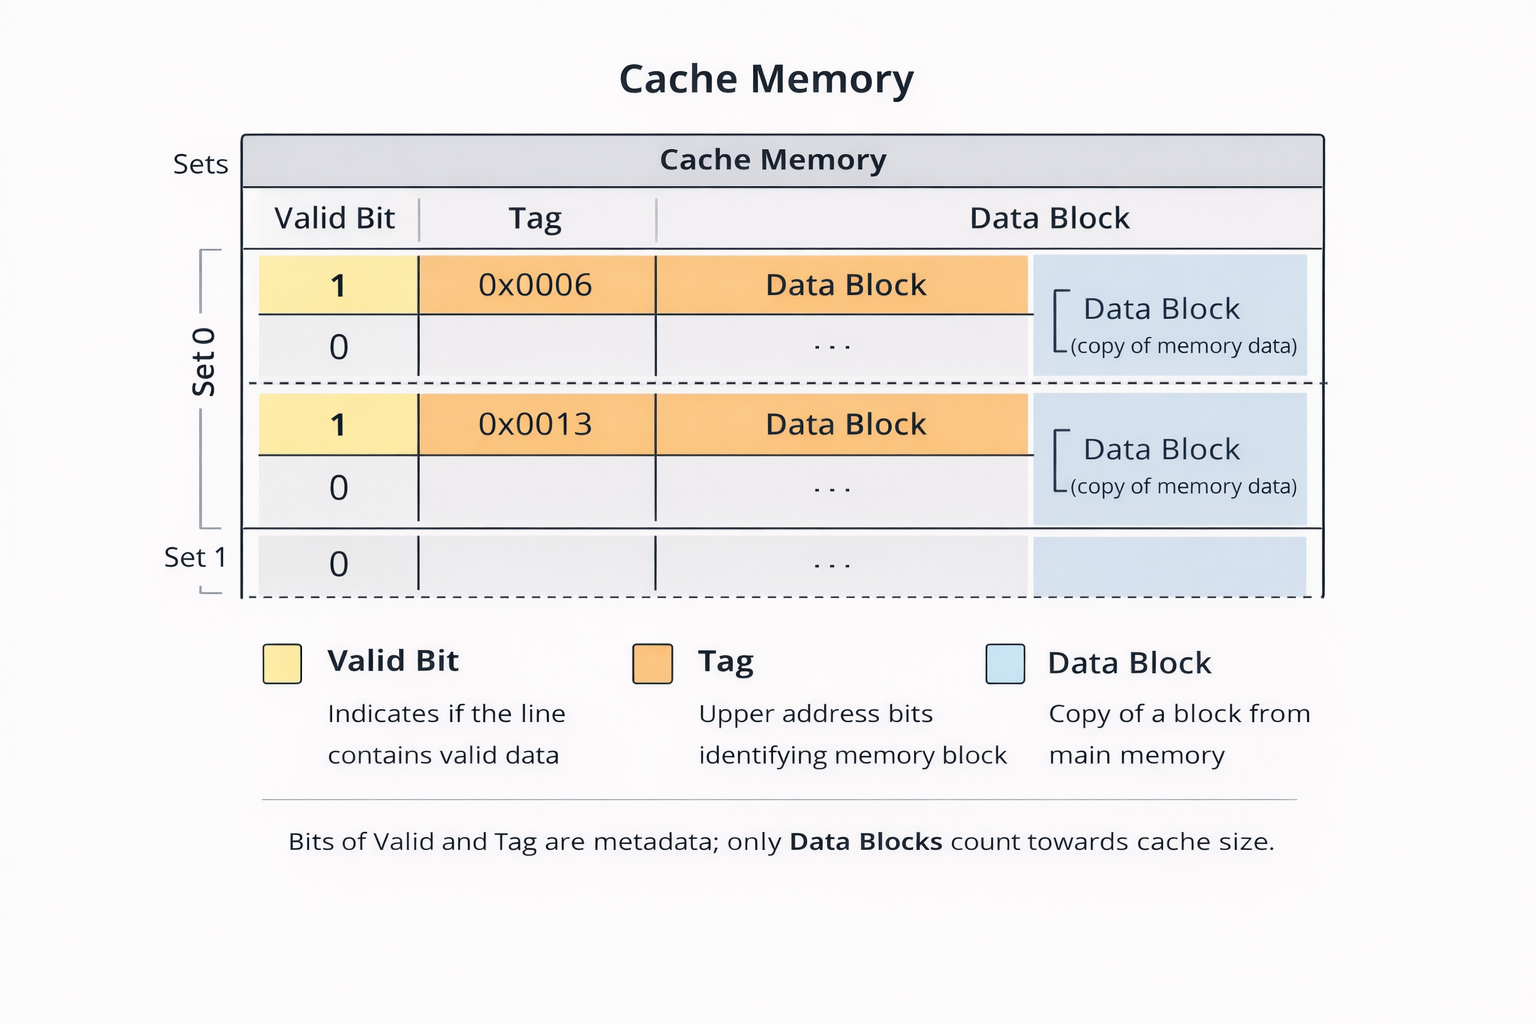
How the Cache Responds to an Access Request
When the CPU requests data, the cache executes a well-defined sequence of steps:
-
Set Selection
The cache uses the set index bits of the address to select exactly one set (set). -
Line Matching (Hit or Miss)
Within the selected set:- if there is a valid line whose tag matches the address, a cache hit occurs;
- otherwise, a cache miss occurs.
-
Word Extraction
In case of a hit, the block offset bits indicate where the data is located within the block, and it is immediately returned to the CPU. -
Line Replacement on Misses
In case of a miss, the corresponding block is fetched from the next level of the memory hierarchy and stored in the cache, possibly replacing an existing line.
⚠️ Impact of Cache Usage on Determinism
The use of cache memories generally improves a program's average performance by reducing the number of accesses to main memory, but this same mechanism creates **unpredictable variation in memory access times**, which compromises the determinism of an algorithm's execution. This occurs because the effective latency of a read/write operation depends on the internal state of the cache (that is, whether the data is present or not), such that identical sequences of instructions can lead to different execution times at different moments — a phenomenon widely documented in the computer architecture literature as one of the main sources of execution-time variability in modern processors. This variability results from cache hits and cache misses, line replacement policies, and mapping conflicts, which make access time non-deterministic and dependent on execution history. For this reason, caches are frequently cited in performance studies as a factor that breaks a program's temporal predictability, complicating formal execution-time analyses and leading to the need for special techniques when strict determinism is desired.
Experiments
The experiments in this section were carried out on real hardware using the
LP-AM243
board (AM243x General Purpose LaunchPad™ Development Kit), running code on the core
Arm® Cortex®-R5F (R5FSS0-0) in NoRTOS mode. Development was based on the
Texas Instruments MCU+ SDK for AM243x, using the
dpl_demo example as a starting point, which already provides initialization infrastructure and time measurement via the
CPU cycle counter (CycleCounterP). This setup allows the impact of different
memory access patterns on cache behavior to be evaluated in a reproducible way.
Experiment 1: Spatial Locality and Cache — Row-Major vs Column-Major
In this first experiment, we evaluate the impact of memory access order on a two-dimensional array, comparing two classic patterns: row-major and column-major. In both cases, the algorithm executes exactly the same number of arithmetic operations and the same number of memory accesses, traversing all elements of the matrix exactly once. The only difference between the versions lies in the order in which these elements are visited. When the matrix is traversed by rows (row-major), the access pattern matches the natural layout of the C language, in which the elements of the same row are stored contiguously in memory. This pattern corresponds to a stride-1 access, strongly exploiting spatial locality and allowing each loaded cache line to be extensively reused. In contrast, when traversing the matrix by columns (column-major), the code starts accessing elements separated by a large offset in memory, equivalent to the size of an entire row of the matrix. Although the total number of accesses remains the same, this pattern results in poor spatial locality, a higher cache miss rate, and consequently, longer execution time. Thus, the experiment shows that seemingly trivial changes in loop structure can have a significant impact on how well the memory hierarchy is exploited.
Cache spatial locality experiment on the AM243x (row-major vs column-major)
      #define MAT_ROWS 128                         // Number of matrix rows
      #define MAT_COLS 128                         // Number of matrix columns

      static uint32_t gMatrix[MAT_ROWS][MAT_COLS]
          __attribute__((aligned(64)));           // 128x128 matrix (64 KB), aligned to a cache line

      volatile uint32_t gResultSink;                  // Prevents the compiler from eliminating the loops


      static uint32_t accumulate_by_rows(void);   // Prototype: row-major access
      static uint32_t accumulate_by_columns(void); // Prototype: column-major access


      static uint32_t accumulate_by_rows(void)   // Function with good spatial locality
      {
          uint32_t r, c;                              // Matrix indices
          uint32_t acc = 0;                         // Sum accumulator

          for (r = 0; r < MAT_ROWS; r++)          // Iterates over rows (row-major)
          {
              for (c = 0; c < MAT_COLS; c++)      // Iterates over columns sequentially
              {
                  acc += gMatrix[r][c];               // Contiguous memory access (good locality)
              }
          }

          return acc;                                 // Returns total sum
      }


      static uint32_t accumulate_by_columns(void) // Function with poor spatial locality
      {
          uint32_t r, c;                              // Matrix indices
          uint32_t acc = 0;                         // Sum accumulator

          for (c = 0; c < MAT_COLS; c++)          // Iterates over columns first
          {
              for (r = 0; r < MAT_ROWS; r++)      // Jumps large distances in memory
              {
                  acc += gMatrix[r][c];               // Breaks spatial locality
              }
          }

          return acc;                                 // Returns total sum
      }


      void dpl_demo_main(void *args)              // Main function of the DPL example
      {
          uint32_t start, end, delta;                 // Cycle measurement variables
          uint32_t r, c;                              // Auxiliary indices
          uint32_t sum;                               // Result of the sums

          DebugP_log(0);                             // Initial console synchronization

          for (r = 0; r < MAT_ROWS; r++)          // Matrix initialization
          {
              for (c = 0; c < MAT_COLS; c++)      // Deterministic fill
              {
                  gMatrix[r][c] = r + c;               // Simple and reproducible value
              }
          }

          CycleCounterP_reset();                      // Resets the cycle counter
          start = CycleCounterP_getCount32();         // Marks start (good locality)

          sum = accumulate_by_rows();                 // Executes row-major access
          gResultSink = sum;                          // Prevents optimization

          end = CycleCounterP_getCount32();           // Marks end
          delta = end - start;                        // Calculates cycles spent

          DebugP_log(delta);                          // Displays time for good locality

          CycleCounterP_reset();                      // Resets counter again
          start = CycleCounterP_getCount32();         // Marks start (poor locality)

          sum = accumulate_by_columns();              // Executes column-major access
          gResultSink = sum;                          // Prevents optimization

          end = CycleCounterP_getCount32();           // Marks end
          delta = end - start;                        // Calculates cycles spent

          DebugP_log(delta);                          // Displays time for poor locality
      }
Result
Below are the results obtained during the execution of the experiment in Code Composer Studio, showing the times measured in CPU cycles for the two patterns of memory access evaluated. Measurements were collected directly from the debug console, using the cycle counter of the Arm® Cortex®-R5F core, which allows an objective comparison of the impact of spatial locality on cache performance.

Experiment 2 — Memory Access with Cache Disabled
In this second experiment, the processor's data and instruction cache was explicitly
disabled before running the tests, through a call to the function
CacheP_disable(CacheP_TYPE_ALL). This modification was inserted immediately before
the experimental block, keeping unchanged the matrix size, the number of memory accesses,
and the body of the loops used in Experiment 1. The goal is to isolate the impact of cache on the
previously observed performance and verify whether the advantage of row-major access
persists when all accesses are served directly by memory.
Result
With the cache disabled, execution time increased significantly in both cases. Compared to Experiment 1 (cache enabled), row-major access went from approximately 460 thousand cycles to about 5.45 million cycles, representing an increase of roughly 12 times. Similarly, column-major access showed practically identical time, also around 5.45 million cycles. The difference between the two patterns became statistically irrelevant, showing that, in the absence of cache, the order of matrix access no longer influences performance. This result confirms that the gain observed in Experiment 1 is a direct consequence of the cache exploiting spatial locality.

The results of Experiment 2 demonstrate that, without the presence of cache, there is no measurable benefit associated with spatial locality. Although the total cost of memory access increases significantly, the matrix scanning order ceases to be a relevant factor for performance. Together with Experiment 1, these results clearly establish the causal relationship between memory locality, cache, and execution time on the AM243x.
Experiment 3 — Impact of Cache State on Temporal Determinism
In this third experiment, the goal is to demonstrate that, even with the cache enabled, the execution time of the same code can vary depending on the initial state of the cache, characterizing a loss of temporal determinism. To do this, exactly the same code from Experiment 1 was reused, including the matrix size, the number of memory accesses, and the CPU cycle measurement methodology. The only difference introduced was the execution of a cache pollution routine immediately before the start of the experiment, deliberately altering the cache contents without modifying the main code.
The experiment was divided into two phases executed sequentially within the same system boot. In the first phase (baseline), matrix access was performed with the cache enabled and without any prior interference, representing a relatively clean initial cache state. In the second phase, an additional routine was executed before the experiment with the purpose of polluting the cache, accessing memory regions with low spatial locality. In both phases, execution times were measured for the row-major (by rows) and column-major (by columns) accesses.
Result
The results showed that, although the executed code was identical in both phases, the measured times exhibited measurable variations. For row-major access, the time went from approximately 485 thousand cycles in the run without pollution to about 491 thousand cycles after cache pollution, representing a variation of approximately 1%. For column-major access, a variation of approximately 0.4% was observed, with a reduction in the number of cycles after pollution.
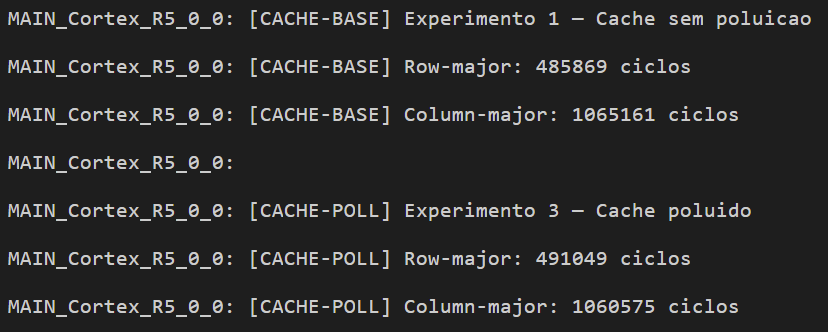
Although the observed variations are relatively small in absolute terms, they are technically significant, since they occur without any change to the code, the data, or the execution platform. The only variable modified was the internal state of the cache, which is not explicitly controlled by the programmer. This result demonstrates that, with the cache enabled, execution time ceases to be strictly deterministic, becoming dependent on the history of memory accesses and the cache's prior contents.
Main Conclusion
Together, the three experiments clearly demonstrate the role of cache in the system's performance and temporal behavior. The first experiment showed that cache significantly improves performance by exploiting spatial locality, reducing the number of cycles necessary to access memory when the access pattern is favorable. The second experiment showed that disabling the cache results in a significant drop in efficiency, leading to much longer execution times that are practically independent of the matrix access pattern. Finally, the third experiment confirmed that, with the cache enabled, execution time becomes dependent on the internal state of the system, since variations in the initial cache state are enough to produce measurable differences in the number of cycles executed. These results reinforce the fundamental trade-off between performance and temporal predictability, justifying careful use of cache in critical real-time systems, where rigorous temporal analyses are essential.
Code Availability
The experiment's source code is available on GitHub:

Comments and discussion